– Posted on May 4, 2013

The World Meteorological Organisation revealed in Statement on the Status of the Global Climate, that during the August to September 2012 melting season, the Arctic’s sea ice cover was just 3.4 million square kilometres (1.32 million square miles). That is equal to 18% less than record low set in 2007. Last year was the ninth warmest year since recorded history and the 27th consecutive year that the global land and ocean temperatures were above the 1961–1990 average.
The 2012 global land and ocean surface temperature during January–December 2012 is estimated to be 0.45°C (±0.11°C) above the 1961–1990 average of 14.0°C. The years 2001–2012 were all among the top 13 warmest years on record. Last year’s warming came despite a cooling La Nina at the beginning of the year.
Above-average temperatures were observed across most of the globe’s land surface areas, most notably North America, southern Europe, western Russia, parts of northern Africa and southern South America while cooler than average conditions were observed across Alaska, parts of northern and eastern Australia, and central Asia.
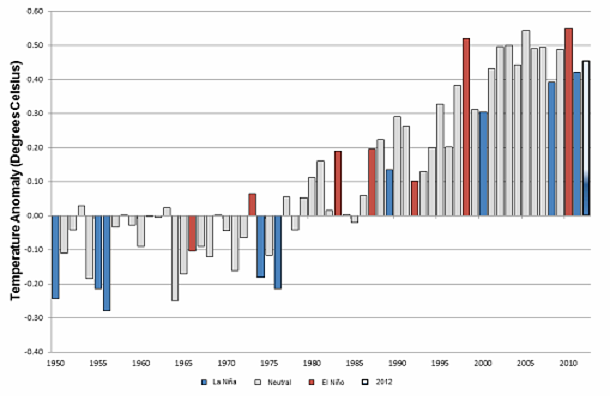
Global land and ocean surface temperature anomalies with respect to the 1961-1990 base period (Source: WMO)
Precipitation also varied, with drier-than-average conditions across much of the central United States, northern Mexico, northeastern Brazil, central Russia, and south-central Australia. Northern Europe, western Africa, north-central Argentina, western Alaska, and most of northern China were meanwhile wetter than average.
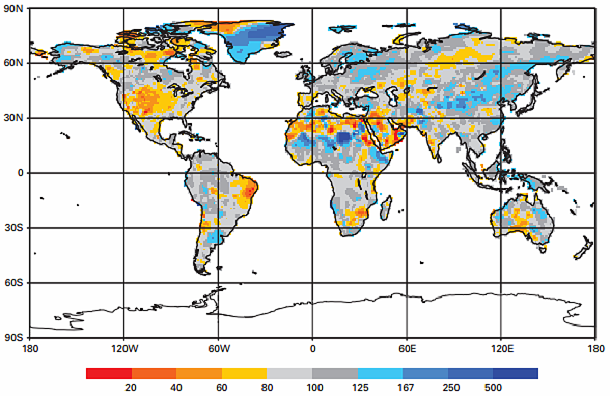
Annual precipitation anomalies for global land areas for 2012; gridded 1.0-degree rain gauge-based analysis as percentages of average focusing on the 1951–2000 base period (Source: Global Precipitation Climatology Centre, Deutscher Wetterdienst, Germany)
According to data from the Global Snow Laboratory, snow cover extent in North America during the 2011/2012 winter was below average. The previous two winters (2009/2010 and 2010/2011) had the largest and third largest snow cover extent, respectively, since records began in 1966.
On the other side, the Eurasian continent snow cover extent during the winter was above average, resulting in the fourth largest snow cover extent on record. Overall, the northern hemisphere snow cover extent was above average – 590000 km2 above the average of 45.2 million km2.
***************************************************************************************************
Antarctic sea ice cover is increasing under the effects of climate change
– Posted on November 18, 2012

Antarctic sea ice drift caused by changing winds are responsible for observed increases in Antarctic sea ice cover in the past two decades according to new study by British Antarctic Survey and NASA. While Arctic experienced dramatic record ice loss due the climate change, Antarctic sea ice cover has increased due the climate change. Antarctic ice cover expands to an area roughly twice the size of Europe during the winter season. By the end of winter the ice covers an area of 19 million square kilometres, more than doubling the size of the continent.

Monthly sea ice extent for October 2012 – Blue Marble view (Image courtesy of the National Snow and Ice Data Center, University of Colorado, Boulder and NASA Earth Observatory)
More than five million daily ice-motion measurements by four U.S. Defense Meteorological satellites, over a period of 19 years, were mapped by JPL and used in research. Scientists Paul Holland of the Natural Environment Research Council’s British Antarctic Survey and Ron Kwok of NASA’s Jet Propulsion Laboratory, analysed data which show long-term changes in sea ice drift around Antarctica for the first time. Before that, researchers used computer models of Antarctic winds.
****************************************************************************************************
Carlos Duarte: “We are facing the first clear evidence of a dangerous climate change”
– Posted on February 3, 2012

“We are facing the first clear evidence of a dangerous climate change. However, some of the researchers and some of the Media are plunged into a semantic debate about whether the Arctic Sea-Ice has reached a tipping point or not. This all is distracting the attention on the need to develop indicators that warn about the proximity of abrupt changes in the future, as well as on the policymaking to prevent them”, prof. Carlos Duarte, Director of the Oceans Institute at The University of Western Australia and Research Professor with the Spanish National Research Council (CSIC) at the Mediterranean Institute for Advanced Studies (IMEDEA) in Mallorca, Spain.
Tipping points are defined as critical points within a system, of which future condition may be qualitatively affected by small perturbations. On the other hand, tipping elements are defined as those components of the Earth system that may show tipping signs.
According to the experts, the Arctic shows the largest concentration of potential tipping elements in Earth’s Climate System: Arctic Sea-Ice; Greenland Ice-Sheet; North Atlantic deep water formation regions; boreal forests; plankton communities; permafrost; and marine methane hydrates among others.
Duarte maintains: “Due to all of this, the Arctic region is particularly prone to show abrupt changes and transfer them to the Global Earth System. It is necessary to find rapid alarm signs, which warn us about the proximity of tipping points, for the development and deployment of adaptive strategies. This all would help to adopt more preventive policies”.
In an article, published in the latest number of ‘AMBIO’, Duarte and other CSIC researchers detail the tipping elements present in the Arctic. They also provide evidence to prove that many of these tipping elements have already entered into a dynamic of change that may become abrupt in most of the cases. According to the study, it is possible to observe numerous tipping elements that would impact on the Global Climate System if they were perturbed.
CSIC scientist explains: “In this work, we provide evidence showing that many of these tipping elements have already started up. We also identify which are the climate change thresholds that may accelerate the global climate change. The very human reaction to climate change in the Arctic (dominated by the increase of activities such as transportation, shipping, and resource exploitation) may contribute to accelerate the changes already happening”. CSIC website
Arctic – 2011 in review

Map of the Arctic (Source: The Perry-Castañeda Library Map Collection)
According to US National Snow and Ice Data Center, Arctic sea ice extent for December 2011 was the third lowest in the satellite record. The five lowest December extents in the satellite record have occurred in the past six years. Including the year 2011, the linear rate of decline ice December ice extent over the satellite record is -3.5% per decade. The Arctic gained 2.37 million square kilometers (915,000 square miles) of ice during the month. The average ice gain for December was 1.86 million square kilometers (718,000 square miles). On December 31, Arctic sea ice extent was 13.25 million square kilometers (5.12 million square miles), 561,000 square kilometers (217,000 square miles) more than the ice extent on December 31, 2010, the lowest extent on December 31 in the satellite record.
Arctic sea ice extent remained unusually low through December, especially in the Barents and Kara seas. In sharp contrast to the past two winters, the winter of 2011 has so far seen a generally positive phase of the Arctic Oscillation, a weather pattern that helps to explain low snow cover extent and warmer than average conditions over much of the United States and Eastern Europe. In Antarctica, where summer is beginning, sea ice extent is presently above average.
*****************************************************************************************************
Related articles
- WMO dubbed last year as disturbing sign of climate change (jericho777.wordpress.com)
- World went on warming in 2012 – WMO (climatenewsnetwork.net)
- WMO Annual Climate Statement Confirms 2012 as Among Top Ten Warmest Years (skepticalscience.com)
- 2012 Confirmed to be among Top 10 Warmest Years : WMO (natureworldnews.com)
- UN alarm over record Arctic melt (smh.com.au)
- Alarm grows on Arctic ice melt (theage.com.au)
- WMO annual climate report confirms 2012 as among top 10 warmest (nzweek.com)
- UN Warns of ‘Worrisome’ and ‘Disturbing’ Signs of Climate Change (commondreams.org)
- Arctic ice melt one of many extremes in 2012: UN (abc.net.au)
- Meanwhile, the globe keeps warming (blogs.redding.com)


